TMS Carbon Emissions Tracking: The 90-Day Configuration Playbook for 2025 Compliance

Starting January 2025, the Corporate Sustainability Reporting Directive (CSRD) mandates that thousands of European companies report detailed Scope 3 emissions, including transportation data that was previously tracked with rough estimates. Nearly 11,700 companies will need to report their greenhouse gas emissions for the first time in 2025, with their reports detailing emissions from their 2024 fiscal years.
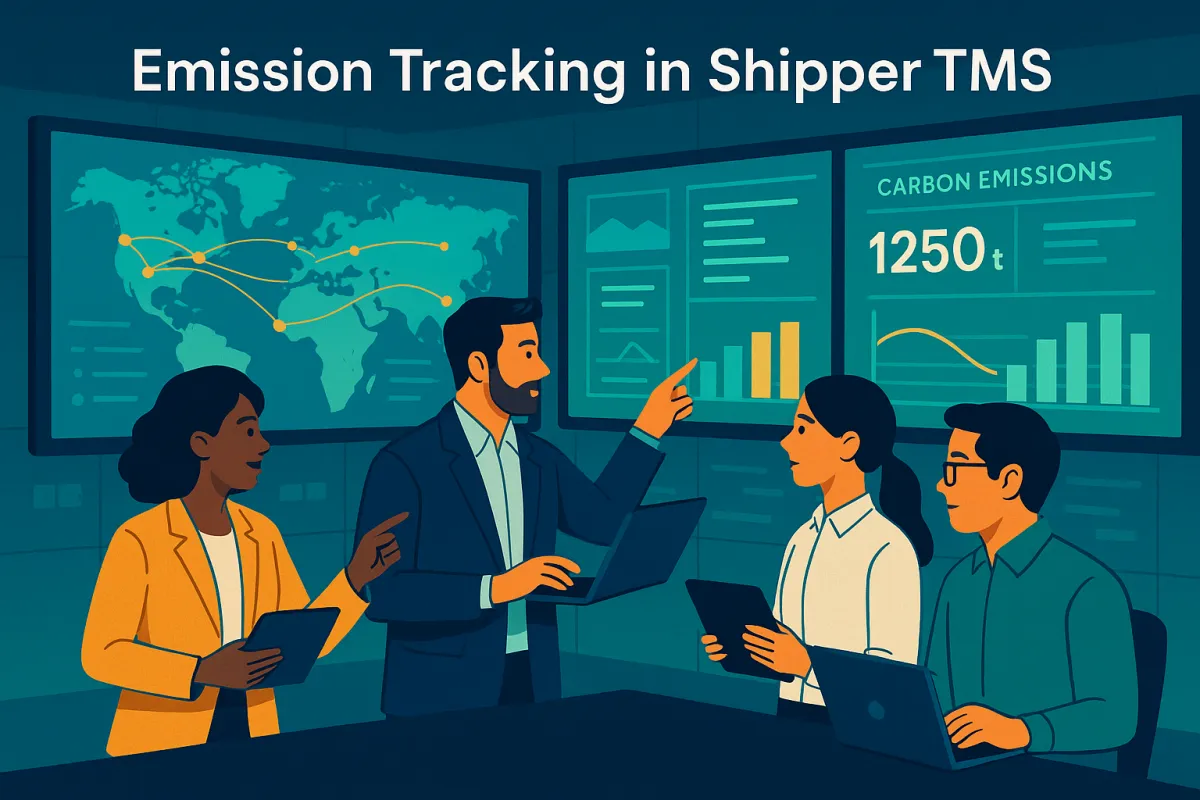
If you're running TMS operations for a manufacturer or retailer, you already know this deadline loomed closer while most systems weren't built for granular emissions tracking. A Shipper TMS is the ideal place to determine carbon emissions by collecting and analyzing data of all transportation activities across different carriers. This 90-day configuration playbook breaks down exactly how to set up carbon emissions tracking in your TMS to meet 2025 compliance requirements.
The 2025 Compliance Reality Check
In the EU, large, listed companies need to begin reporting in 2025 under CSRD, while California mandates Scope 3 reporting for any company operating in the state with more than $1 billion in annual revenue. Companies that meet the CSRD thresholds must report Scope 1, 2 and 3 emissions, with Scope 3 treated as a core part of climate disclosures under ESRS E1.
Your TMS needs to track everything at shipment level, not the industry averages you might have used before. Companies will face unprecedented level of data-intensive, highly granular reporting because of the CSRD and ESRS. Major TMS vendors like Descartes, Blue Yonder, MercuryGate, Oracle TM, and Cargoson have all added sustainability modules to handle this demand.
What Changed: From Estimates to Granular Data
Previously, you could approximate emissions using one container's data for hundreds of similar shipments. That approach won't pass regulatory scrutiny anymore. Scope 3 often includes the largest emission sources, especially in sectors like manufacturing, automotive or consumer goods. Now you need calculations that consider vessel type, route conditions, weather, speed, and actual load for every single shipment.
The difference is stark: old "industry average" calculations might show 2.1 kg CO2 per shipment across your entire network. New granular tracking reveals variations from 0.8 kg for optimized rail segments to 8.7 kg for expedited air freight with partial loads. That variance matters when auditors review your data.
TMS Data Foundation: The 14 Essential Data Points
A TMS measures carbon emissions through mode of transportation, load weight, distance traveled, and fuel consumption data. But compliance-ready tracking needs more granularity than basic TMS reporting usually captures.
Your configuration must collect these 14 data points for every shipment:
- Carrier-specific emission factors (not industry averages)
- Modal specifications (truck class, rail car type, vessel size, aircraft model)
- Actual load weight and volume utilization
- Route distance and duration (including delays, stops, diversions)
- Fuel type and consumption rates
- Load consolidation ratios
- Empty mile percentages
- Temperature control requirements
- Handling and warehouse activities
- Intermodal transfer points
- Weather and traffic impact factors
- Equipment age and efficiency ratings
- Alternative fuel usage
- Return logistics and packaging
Princeton TMX, M2X, and IntelliTrans have built emission tracking features that capture most of these automatically through carrier APIs and telematics integration. Your TMS configuration needs to validate and store this data reliably.
Master Data Setup: Carriers, Modes, and Emission Factors
Start with carrier emission profiles. Each carrier should have verified emission factors for their fleet, updated quarterly. Create validation rules that flag outdated factors and require re-certification. Configure modal factor tables that account for load factors, fuel types, and efficiency improvements.
Set up automatic data quality checks that reject shipments missing emission factor data. You'll need approval workflows when carriers can't provide verified factors, with fallback calculations that meet audit requirements but flag exceptions for review.
Configuration Workflows: The 3-Layer Approach
Build your carbon calculation logic in three layers: real-time execution, batch aggregation, and reporting compilation.
Layer 1: Shipment Execution calculates basic emissions when you book freight, using real-time data where available. Configure triggers that update calculations when shipment details change - route modifications, carrier switches, or load adjustments.
Layer 2: Batch Processing handles data corrections and enrichment. Run nightly jobs that incorporate actual fuel consumption data from carrier systems, weather impact adjustments, and final load confirmations. This layer catches discrepancies between planned and actual performance.
Layer 3: Reporting Aggregation compiles auditable reports with full traceability. Configure workflows that lock historical data once monthly reports close, preventing retroactive changes that could affect compliance documentation.
Cargoson's calculation engine handles multi-modal shipments particularly well, automatically splitting emissions calculations across different transport legs and consolidating them for accurate Scope 3 reporting. Other platforms require more manual configuration to achieve the same level of detail.
Validation Rules: Catching Bad Data Before It Corrupts Reports
Data quality issues plague 90% of current emissions implementations. Configure validation rules that catch problems before they reach your compliance reports:
- Weight-volume consistency checks (reject shipments where density seems impossible)
- Route distance validation (flag routes that vary more than 15% from established baselines)
- Carrier factor freshness (require updated emission factors within 90 days)
- Modal logic verification (ensure rail segments don't show truck emission factors)
- Load factor reasonableness (flag utilization rates above 100% or below 5%)
Build exception dashboards that show validation failures in real-time. Configure automated workflows that route data quality issues to appropriate teams - carrier management for factor updates, operations for route corrections, IT for system integration problems.
Dashboard Configuration: Making Data Actionable
TMS allows companies to compare emissions footprint of different transport scenarios before booking freight, with best-in-class systems including emissions calculations alongside cost and other variables when selecting carriers.
Configure three dashboard tiers:
Executive Summary Views show monthly aggregate emissions by business unit, with trend analysis and regulatory compliance status. Include variance explanations and corrective actions for any spikes or anomalies.
Operational Dashboards give daily decision-making data. Show emissions per shipment, carrier performance on sustainability metrics, and modal shift opportunities. Configure alerts when shipments exceed emission thresholds or when greener alternatives exist.
Carrier Scorecards help procurement teams evaluate sustainability performance. Track emission factor accuracy, data submission timeliness, and improvement trends. This feeds directly into carrier renewal negotiations.
MercuryGate and Oracle TM offer robust dashboard customization, while Descartes provides strong out-of-box sustainability reporting. Cargoson balances both approaches with configurable templates that work well for most manufacturers without extensive customization.
Automated Reporting: Meeting Different Regulatory Formats
Configure automated report generation that outputs CSRD-compliant formats, SEC filing requirements, and local regulatory templates. Build scheduling automation that generates monthly sustainability reports, quarterly compliance summaries, and annual audit packages.
Set up data export workflows that package shipment-level detail with aggregated summaries. Auditors need drill-down capability from high-level numbers to individual shipment calculations. Configure your exports to include calculation methodologies, data source documentation, and assumption justifications.
Integration Challenges: ERP, WMS, and External Data Sources
Your TMS doesn't operate in isolation. Configure API connections to carrier emission databases, ERP systems for cost allocation, and third-party emission factor providers for validation.
Common integration points include:
- Carrier APIs for real-time emission factors and fuel consumption data
- ERP integration for cost center allocation and business unit reporting
- WMS connections for actual weight and packaging data
- Weather services for route impact adjustments
- Fuel price feeds for alternative fuel cost-benefit analysis
Most major TMS platforms including Cargoson handle these integrations through standard APIs, but you'll need to configure data mapping, error handling, and fallback procedures when external systems are unavailable.
90-Day Implementation Timeline
Break your implementation into three phases to meet January 2025 deadlines:
Days 1-30: Data Foundation Configure master data tables, set up carrier emission factor collection, and establish validation rules. Focus on data quality before building calculations. Get your top 10 carriers providing verified emission factors.
Days 31-60: Workflow Configuration Build the three-layer calculation system, configure dashboard templates, and set up integration connections. Test with historical data to verify calculations match manual spot checks.
Days 61-90: User Training and Go-Live Train operations teams on new workflows, configure automated reporting schedules, and run parallel calculations with your existing process. Validate final outputs against regulatory requirements.
Implementation timelines vary by vendor. Descartes and Oracle TM typically need 4-6 months for full sustainability module deployment. Cargoson and similar cloud-native platforms can often deliver functional configurations in 60-90 days, making them viable for tight compliance deadlines.
Post-Go-Live: Continuous Improvement and Audit Readiness
Configure monthly data quality reviews that check emission factor freshness, validate calculation accuracy against spot audits, and update methodologies as regulations evolve. Build audit trails that preserve historical calculation methods even as you improve accuracy.
Set up stakeholder communication workflows that explain emissions variances to business units and provide improvement recommendations. Configure scenario analysis tools that help operations teams understand the emission impact of routing decisions before they commit to carriers.
Your TMS carbon emissions tracking becomes a competitive advantage when it's built correctly. Companies that get this right by 2025 will have cleaner data, better carrier relationships, and operational insights that drive both compliance and cost savings.