TMS Carbon Emissions Tracking: The 90-Day Setup Playbook for 2025 Compliance

The CO2 communication obligation is no longer a future constraint: it has been applicable since January 1, 2025, with financial penalties at stake. Since January 1, 2025, a new obligation has radically transformed the daily operations of carriers and distributors: communicating the CO2 emissions of their transport services to shippers. This measure, inscribed in article L1431-3 of the transport code, is now accompanied by fines that can reach €3,000 for non-compliance. The first companies subject to the Corporate Sustainability Reporting Directive (CSRD) have to apply the new rules for the first time in the 2024 financial year, for reports published in 2025. Many EU member states have transposed the CSRD into national law and 2025 marks the initial year of reporting for the first companies in scope of the regulation (on fiscal year 2024 information). Starting in 2025, CSRD will mandate that businesses have a Paris Agreement-aligned emissions reduction plan to reach net zero by 2050.
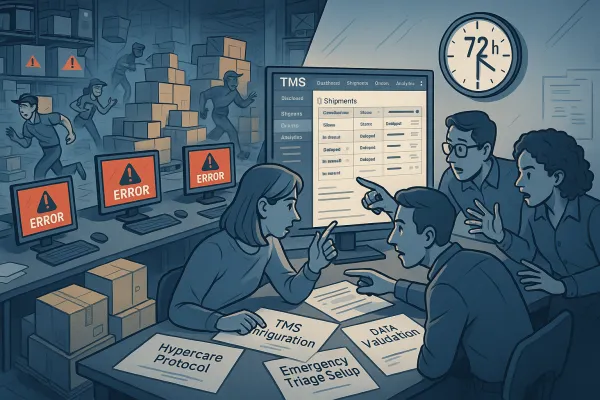
Your TMS carbon emissions tracking setup determines whether you face these penalties or gain competitive advantage. Most shippers discover their existing data collection can't meet the new standards. This 90-day playbook walks you through the technical configuration, data migration, and operational processes needed to deliver audit-ready emissions tracking that actually drives decision-making.
Why TMS Carbon Tracking Is Now Mission-Critical for Shippers
To regulate this, the European Union has developed a reporting requirement – the Corporate Social Responsibility Directive (CSRD). A TMS is therefore an indispensable tool to aid with CSRD compliance (and other sustainability reporting standards, such as IFRS S1 and IFRS S2 – as well as future standards being assessed). Ground reality: only 40% of carriers currently comply with this obligation, which has been in effect since 2013 for CO2 and extended to all greenhouse gases since 2017.
The regulatory pressure creates immediate business impact. The European Union has set ambitious targets: 30% reduction in CO2 emissions from heavy-duty vehicles by 2030, with intermediate steps starting in 2025. Carbon emissions in the shipping industry account for about 3% of global greenhouse gas emissions (Source: European Commission), making logistics emission reduction a critical priority.
Major TMS vendors responded quickly. The IntelliTrans CO2 Emissions Tracker delivers shipment-level accuracy by calculating Scope 3 CO2 emissions across truck, rail, and ocean freight using actual shipment data. Reports are aligned with ISO 14083 and GLEC frameworks, giving shippers compliance and ESG reporting they can trust. Princeton TMX introduced sustainability tools within their platform, while vendors like MercuryGate, Descartes, Manhattan Active, Blue Yonder, and Cargoson rolled out integrated carbon tracking capabilities.
Notice the pattern here? The vendors who moved fast on emissions tracking are positioning themselves as compliance partners, not just software suppliers.
Week 1-15: Data Foundation and System Assessment
Start with a brutal audit of your existing shipment data. Most TMS implementations capture mode, weight, and distance but miss the granular details needed for accurate emissions calculations. You need fuel consumption data, engine efficiency metrics, and load utilization rates that many systems track inconsistently.
Your carrier data standardization becomes the bottleneck. Different carriers report fuel efficiency in different units, use different calculation methodologies, and provide varying levels of detail. Create a master data template that normalizes: actual fuel consumption per mile/km, vehicle specifications and age, load factors for LTL vs FTL shipments, and routing efficiency metrics.
Historical data migration presents unique challenges. Many companies discover significant gaps in their traceability. You can't retroactively create missing emission factors, but you can establish baseline calculations using industry averages for the past 12-18 months. This baseline becomes your improvement benchmark.
The key data points you must collect include mode of transportation with specific vehicle types, actual load weight and capacity utilization, distance traveled with routing specifics, and fuel consumption across truck, rail, ocean, and air transport. Missing any of these creates compliance gaps that auditors will identify immediately.
Week 16-30: Emissions Calculation Engine Configuration
Reports are aligned with ISO 14083 and GLEC frameworks, giving shippers compliance and ESG reporting they can trust. The software is certified by Smart Freight Centre for the ISO14083 standard and accredited to be in accordance with the GLEC Framework. Your calculation engine must support both standards to meet varying customer and regulatory requirements.
Configure automatic collection at the point of shipment execution using actual operational data. Real-time integration with your dispatch system captures load weights, routing decisions, and carrier assignments as they happen. This eliminates the manual data entry that creates errors and audit failures.
Mode-specific emission factors require careful setup. Rail transport can reduce emissions by up to 65% for shipments over 1,000 miles compared to trucking alone. Your system needs different calculation logic for truck (actual fuel consumption), rail (ton-miles with energy efficiency), ocean freight (container utilization and vessel efficiency), and air cargo (weight-distance calculations with aircraft specifications).
Integration with third-party emissions calculators like EcoTransIT World provides the scientific accuracy that internal calculations can't match. EcoTransIT World is the globally used software for automated calculation and analysis of energy consumption and emissions in global freight transport. In collaboration with the scientific institutes ifeu, INFRAS and Fraunhofer IML, EcoTransIT World uses a scientific and neutral, energy-based bottom-up methodology.
TMS platforms like IntelliTrans, Princeton TMX, M2X, and Cargoson offer pre-built integrations that reduce configuration time from months to weeks.
Week 31-45: Reporting Dashboard and KPI Setup
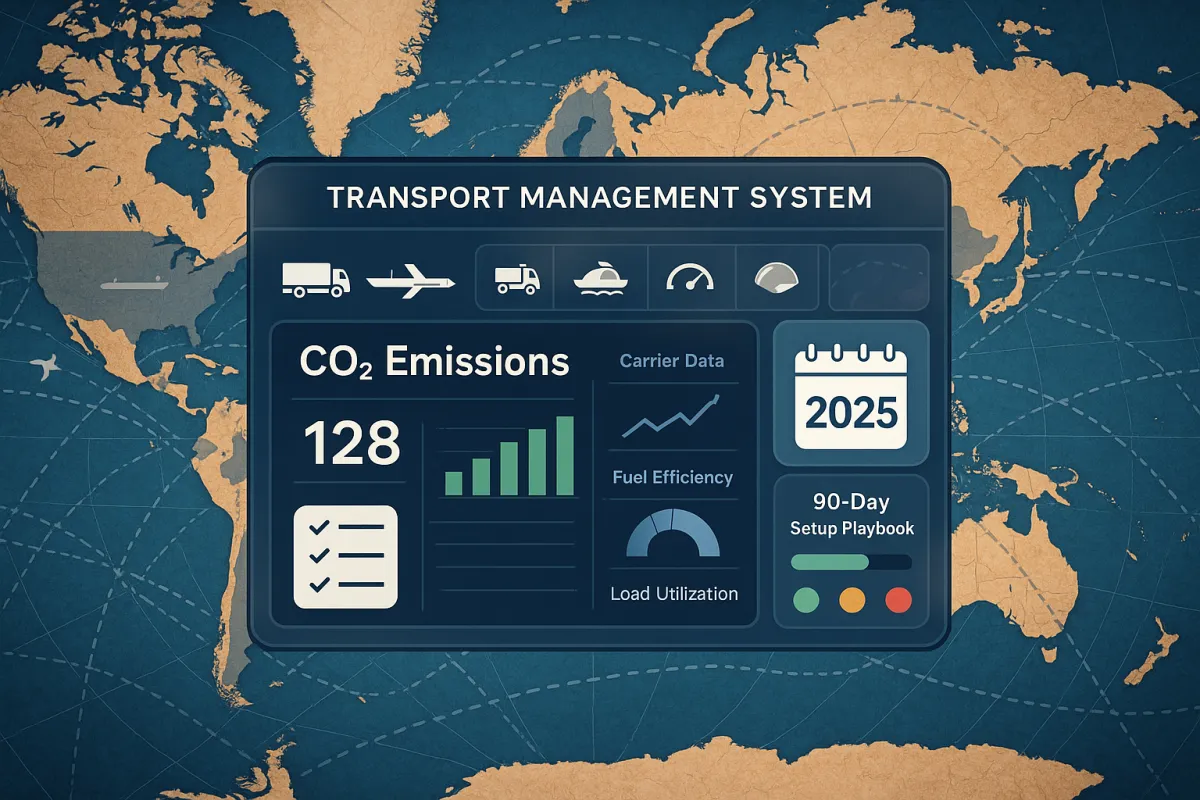
Thanks to Generix TMS, the company can draw up an accurate carbon balance from the operational, forecast and actual data provided. It also has access to the Datapower dashboard, with more than 100 performance indicators (KPI), to analyze the transport activity according to several criteria Your dashboard architecture determines whether emissions data drives decisions or becomes another compliance checkbox.
Build carbon balance reports that combine operational, forecast, and actual data with performance indicators that track emissions by load, route, carrier, and time period. The real value comes from side-by-side comparisons of emissions, costs, lead times, and service levels that enable informed decision-making during transport planning.
Real-time vs batch reporting considerations affect both system performance and user adoption. Real-time dashboards work for daily operations decisions but require significant processing power. Batch reporting (hourly or daily updates) provides sufficient accuracy for most compliance requirements while maintaining system performance.
Stakeholder-specific dashboard configurations prevent information overload. Operations teams need route-level emissions data with alternative options. Finance teams require cost-per-ton-CO2 calculations and budget variance reports. Executive dashboards focus on trend analysis and compliance status with regulatory deadlines.
Your KPI structure should include total emissions by scope (1, 2, and 3), emissions intensity per ton-km or shipment, carrier performance rankings by emissions efficiency, and modal shift opportunities with quantified CO2 savings potential.
Week 46-60: Carrier Integration and Data Validation
Direct ELD integration and engine telemetry provide specific emissions data by freight movement that estimates can't match. The system automatically applies regulatory emission factors and generates CO2 information for each service. This automation eliminates manual calculations while ensuring consistency across all shipments.
Carrier onboarding for emissions data sharing requires standardized APIs and data formats. Establish minimum data requirements: actual fuel consumption, vehicle specifications, routing efficiency, and load factors. Carriers who can't provide this data automatically receive higher emission factor assignments that reflect the uncertainty.
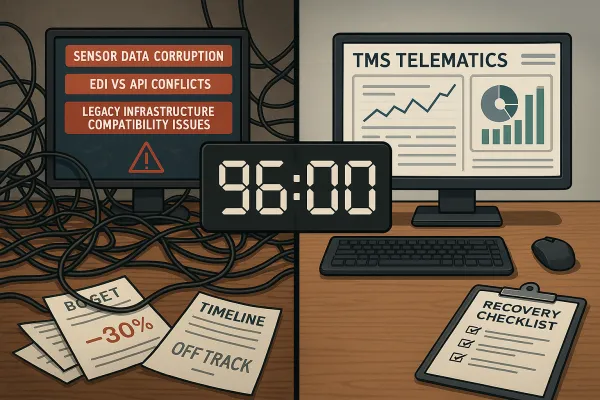
Data quality controls catch discrepancies before they affect compliance reporting. Set validation rules for fuel consumption vs distance traveled, load weight vs vehicle capacity, and routing efficiency vs standard benchmarks. Each calculation is documented and archived automatically. In case of inspection, the company immediately has the complete history of data and the calculation method used.
Handling CO2 allocation for LTL/groupage scenarios across multiple customers creates complex attribution challenges. Use weight-based allocation for direct emissions and distance-based allocation for routing efficiency. Document your methodology clearly since auditors will scrutinize these calculations.
Integration platforms like Shippeo, Chain.io, and Cargoson offer pre-built carrier connections that accelerate onboarding from months to weeks.
Week 61-75: User Training and Process Integration
Operational teams must understand the stakes of CO2 regulations and master the new tools. This training prevents handling errors and guarantees data reliability. User adoption determines whether your emissions tracking delivers compliance or becomes shelf-ware.
Set up continuous monitoring with real-time emissions reports for tracking carbon footprint over time. Train your dispatch teams to use emissions data alongside cost and service level information when making carrier selection and routing decisions. This integration makes sustainability operational, not theoretical.
Create emissions-aware decision-making workflows that present carbon impact during route planning, carrier selection, and modal choice decisions. Shippers can quickly identify carbon "hot spots" by lane, mode, or carrier, and use those insights to shape smarter strategies. For example, they may uncover opportunities to select a shorter rail lane between two facilities or consolidate truckloads to reduce overall shipment frequency.
Exception handling workflows manage missing or invalid data without stopping operations. When carrier emissions data is unavailable, your system applies industry-standard factors while flagging the calculation method for audit trail purposes.
Training your teams on these workflows takes longer than teaching software features. People need to understand why emissions matter, how the calculations work, and what actions they can take to improve performance.
Week 76-90: Go-Live and Optimization
The CO2 tracker empowers transportation professionals to move beyond reporting and toward action. By making emissions data transparent and actionable, IntelliTrans helps bulk and break-bulk industries turn compliance into progress—building greener, more efficient supply chains.
Moving beyond reporting requires identifying carbon hot spots by lane, mode, or carrier and taking specific actions. Your data reveals which routes consistently generate high emissions, which carriers perform below benchmark, and where modal shifts create the biggest impact.
Allocate cost to carbon emissions to enable automated sustainable decision-making in transport planning. When your TMS calculates the true cost of emissions (using carbon pricing or internal carbon costs), route optimization algorithms can balance cost, service, and sustainability automatically.
Performance monitoring tracks improvement over time rather than just compliance status. Weekly reviews of emissions intensity trends, carrier performance changes, and modal shift adoption rates keep momentum after go-live.
Prepare for audit requirements by documenting your calculation methodologies, data sources, and validation procedures. In case of inspection, the company immediately has the complete history of data and the calculation method used. Auditors focus on data integrity, calculation accuracy, and process consistency.
Competitive solutions from Blue Yonder, Manhattan Associates, Descartes, and Cargoson continue evolving their emissions tracking capabilities. Stay current with platform updates and new integration options.
Post-Implementation: Measuring Success and ROI
Key metrics for carbon reduction performance include percentage reduction in emissions per ton-km, modal shift adoption rates, carrier performance improvement, and cost savings through route optimization. These metrics demonstrate business value beyond compliance.
Cost savings through route optimization and modal shifts often exceed the implementation investment within 12-18 months. Although there is significant investment required, embracing cleaner fuel options will help to reduce emissions from transport. Rail transport can reduce emissions by up to 65% for shipments over 1,000 miles compared to trucking alone.
Compliance audit preparation requires documented processes, validated data, and clear audit trails. European regulation provides for even more ambitious reduction targets: 45% by 2030, 65% by 2035, and 90% by 2040. Your system must scale to meet these evolving requirements.
Future-proofing for emerging regulations means building flexibility into your data model and calculation engine. Environmental requirements will strengthen. Companies that master their carbon footprint today are better prepared for future regulatory changes.
The shippers who invested in comprehensive TMS carbon tracking during 2025 positioned themselves ahead of competitors still struggling with spreadsheets and manual calculations. Your 90-day implementation creates the foundation for sustainable logistics operations that meet both regulatory requirements and business objectives.