TMS Data Quality Crisis: The 6-Step Diagnostic That Fixes Analytics Failures in 48 Hours

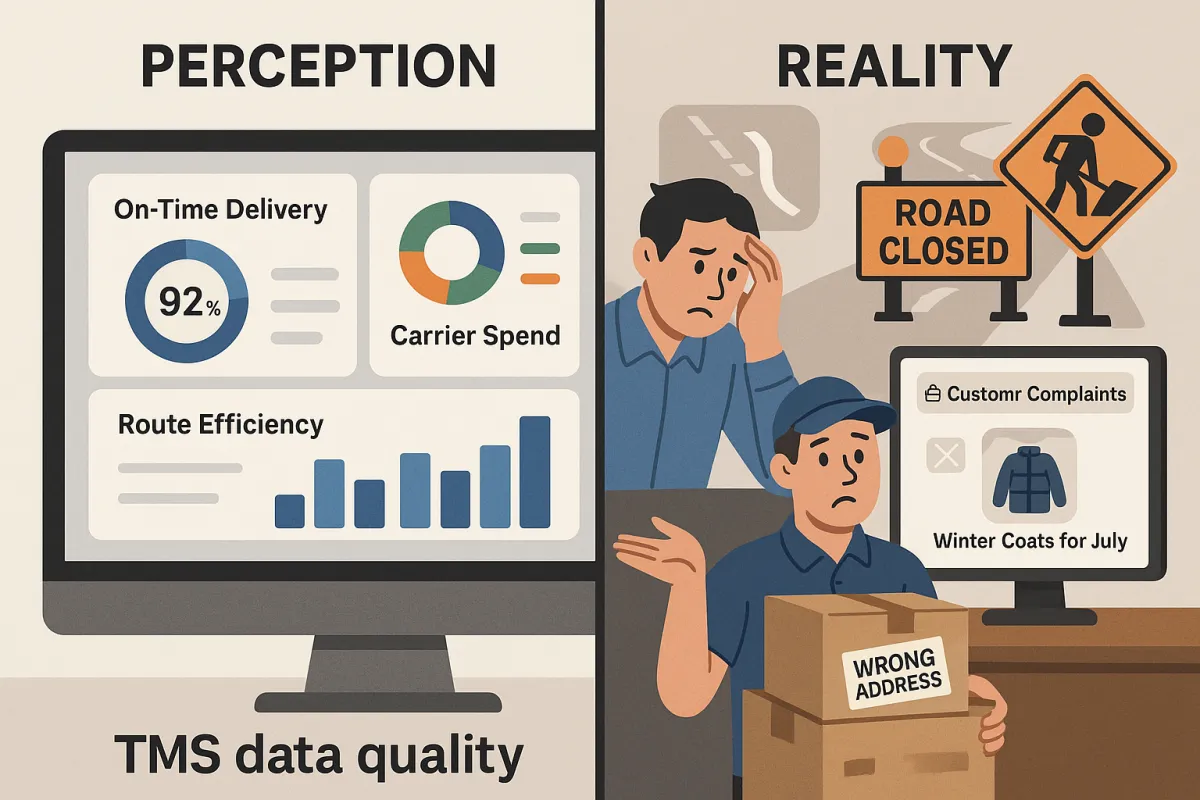
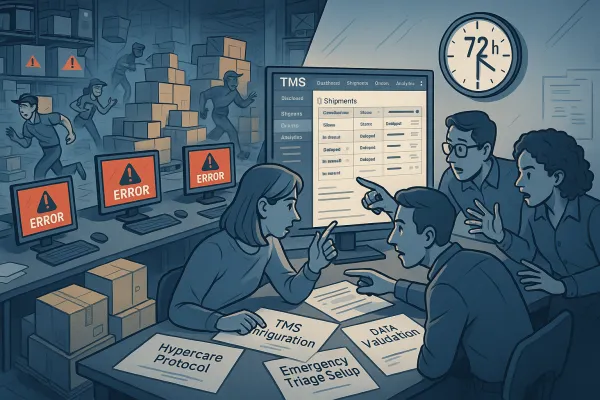
Your TMS analytics dashboard shows perfect numbers. On-time delivery sits at 98%, carrier spend looks optimized, and route efficiency metrics hit industry benchmarks. Data quality issues directly impact business decisions and operational efficiency. From inaccurate decisions to failed audits, the cost of poor-quality data compounds quickly across operations, analytics, and compliance.
Then reality hits. Customer complaints spike because "delivered" packages never arrived. Route optimization chooses highways under construction because your data feeds are three days behind. Your AI-powered demand forecasting system recommends stocking winter coats in July because product category mappings got corrupted during the last integration.
The problem isn't your TMS capabilities - it's the foundation everything sits on. A study revealed that 30% of businesses deal with inaccurate data during new software rollouts. Tailored systems implement validation checks, reducing human error significantly. When TMS data quality fails, every prediction, optimization, and decision becomes unreliable.
The Hidden Cost of TMS Data Quality Failures
Poor data quality doesn't just break reports. It breaks trust. When you don't have the data you need, the promised analytics are either unavailable, insufficient, inaccurate or late. The data you require to improve your efficiency is not available through current sources. If you have data, it's likely uncleansed, unstructured, and unstandardized. Or, your TMS is incapable of ingesting, processing, and reporting it.
Consider these scenarios playing out in TMS environments daily:
- Route optimization algorithms send trucks down closed roads because construction updates aren't flowing from city feeds
- Carrier scorecards rank reliable partners poorly due to duplicate tracking records inflating delay counts
- Predictive analytics suggest increasing capacity for Q4 based on historical data that includes one-time pandemic spikes
- Cost analysis reports show freight rates dropping when currency conversion errors make international shipments appear cheaper
Each failure cascades. Wrong route recommendations waste fuel and driver hours. Inaccurate carrier rankings damage partnerships with your best providers. Capacity planning based on flawed predictions leads to overstaffing or service failures.
The math is brutal. McKinsey found that data processing and cleanup can consume over 30% of analytics teams' time due to poor data quality and availability. Your expensive TMS analytics investment becomes a liability when teams spend more time questioning data than acting on insights.
The 6 Most Common TMS Data Quality Killers
Six patterns account for most TMS analytics failures. Each has distinct symptoms but similar impacts - they make your data unreliable and your decisions risky.
Duplicate records from multiple data sources happen when the same shipment appears in your TMS from carrier feeds, customer portals, and manual entries. Suddenly one late delivery becomes three incidents, skewing performance metrics.
Incomplete address standardization creates routing nightmares. "123 Main St" and "123 Main Street, Unit A" get treated as different locations, preventing route optimization and accurate delivery estimates.
Inconsistent carrier codes across systems break partner analytics. FedEx appears as "FEDX", "FDX", and "Federal Express" in different data feeds, fragmenting performance tracking.
Missing or incorrect timestamps destroy transit time analysis. When pickup confirmations lack timezone data or use different date formats, your delivery predictions become meaningless.
Currency and unit mismatches distort cost analysis. Mixing USD freight rates with EUR fuel surcharges, or combining metric and imperial weight measurements, produces wildly inaccurate spend reports.
Product classification errors undermine capacity planning. Mismatched commodity codes, hazmat flags, or temperature requirements lead to wrong equipment selection and failed deliveries.
These issues compound across modern TMS platforms - whether you're running Oracle TM, SAP, MercuryGate, Blue Yonder, or emerging solutions like Cargoson. The complexity increases when data flows between your TMS, ERP, WMS, and carrier systems.
Step 1: Data Source Audit (Hours 0-8)
Start by mapping every single data input touching your TMS. Not just the obvious ones - every API endpoint, manual entry form, batch upload process, and legacy system interface.
Create a comprehensive inventory documenting:
- Data source system and owner
- Update frequency and timing
- Data volume and format
- Transformation or validation rules
- Downstream dependencies
Focus particularly on carrier data feeds. Most TMS platforms connect to dozens of carrier APIs, each with different data structures, update schedules, and reliability levels. Document which carriers provide real-time tracking vs. batch updates, timezone handling, and status code mappings.
Map your customer data flows next. Order management systems, customer portals, and EDI connections all feed shipment requirements into your TMS. Inconsistent product codes, address formats, or service level mappings here create problems downstream.
Don't forget internal data sources. Your finance team might upload rate tables quarterly. Operations might manually adjust route constraints. Warehouse systems push inventory availability. Each represents a potential contamination point.
This audit reveals data source reliability patterns. You'll discover that 80% of data quality issues trace back to 20% of your sources - usually the newest integrations or least monitored manual processes.
Step 2: Pattern Recognition Analysis (Hours 8-16)
Now dig into your actual data to identify systematic issues. Use SQL queries to spot patterns that indicate quality problems.
Check for duplicate records with variations:
SELECT shipper_reference, COUNT(*)
FROM shipments
WHERE created_date > '2024-01-01'
GROUP BY shipper_reference
HAVING COUNT(*) > 1
Look for address standardization gaps by finding multiple versions of the same location:
SELECT LEFT(delivery_address, 20), COUNT(DISTINCT delivery_address)
FROM shipments
GROUP BY LEFT(delivery_address, 20)
HAVING COUNT(DISTINCT delivery_address) > 3
Identify carrier code inconsistencies that fragment analytics:
SELECT DISTINCT carrier_name, carrier_code
FROM shipments
WHERE carrier_name LIKE '%FedEx%'
OR carrier_code LIKE '%FDX%'
Track timezone and date format issues by analyzing timestamp patterns:
SELECT DATE_FORMAT(pickup_time, '%H') as hour, COUNT(*)
FROM shipments
WHERE pickup_time IS NOT NULL
GROUP BY hour
ORDER BY hour
Statistical thresholds help prioritize fixes. If more than 5% of shipments have missing delivery addresses, that's a critical issue. If 15% of tracking updates lack timestamps, routing predictions become unreliable.
Document the business impact of each pattern. Duplicate records might inflate delay metrics by 20%. Missing product classifications could affect 30% of your capacity planning accuracy.
Step 3: Impact Assessment Matrix (Hours 16-24)
Not all data quality issues deserve immediate attention. Create a scoring framework that weighs business impact against fix complexity.
Score business impact on three dimensions:
- Revenue effect: Does this issue directly impact customer billing, carrier payments, or cost optimization?
- Operational disruption: How many daily processes depend on this data being accurate?
- Regulatory risk: Could data inaccuracy trigger compliance violations or audit failures?
Rate technical complexity considering:
- Fix scope: Can you solve this with validation rules, or does it require system integration changes?
- Data volume: Are you fixing thousands or millions of records?
- Source system access: Can you modify data at the source, or must you clean it downstream?
Calculate ROI for each fix. Missing delivery confirmations might cost $50 per incident in customer service calls and expedite fees. If you process 10,000 shipments monthly with a 3% confirmation gap, that's $15,000 monthly in preventable costs. A $20,000 fix pays back in six weeks.
Create your action priority list focusing on high-impact, low-complexity fixes first. These quick wins build momentum and demonstrate value while you tackle more complex integration projects.
Step 4: Automated Validation Rules (Hours 24-36)
Prevention beats correction. Build real-time validation into your data ingestion processes to catch quality issues before they contaminate your analytics.
Implement field-level validations first:
- Address format checking using postal validation APIs
- Phone number and email format verification
- Currency and unit consistency enforcement
- Date range and timezone validation
- Required field completeness checks
Add cross-reference validations that check data relationships:
- Carrier service codes must match valid carrier-service combinations
- Delivery addresses should exist within pickup radius constraints
- Product weights must align with packaging specifications
- Delivery dates can't precede pickup dates (accounting for timezones)
Create alert thresholds for pattern detection. If address validation failures spike above 2% in any hour, trigger notifications. When carrier tracking updates drop below expected volumes, flag potential feed issues.
Design approval workflows for edge cases. When validation rules catch potential issues, route them to subject matter experts instead of blocking data flow. Operations teams can approve unusual shipment configurations while maintaining data quality controls.
Your TMS might support built-in validation rules, or you might need middleware solutions. Some platforms like Cargoson include comprehensive data validation frameworks, while others require custom development or third-party tools.
Step 5: Cleansing and Standardization (Hours 36-44)
Now fix your existing data systematically. Start with standardization that impacts the most analytics functions.
Address standardization delivers immediate routing and customer analytics improvements. Use postal validation services to normalize format variations:
UPDATE shipments
SET delivery_address_std = USPS_STANDARDIZE(delivery_address)
WHERE delivery_address_std IS NULL
Carrier code mapping unifies performance analytics. Create a master carrier table and update historical records:
UPDATE shipments s
JOIN carrier_mapping cm ON s.carrier_name = cm.source_name
SET s.carrier_code = cm.standard_code
Duplicate elimination requires careful analysis to avoid losing legitimate data. Use fuzzy matching to identify probable duplicates, then manual review to confirm:
SELECT s1.shipment_id, s2.shipment_id,
       SIMILARITY(s1.shipper_reference, s2.shipper_reference) as ref_score
FROM shipments s1
JOIN shipments s2 ON s1.shipment_id < s2.shipment_id
WHERE SIMILARITY(s1.shipper_reference, s2.shipper_reference) > 0.8
Product classification cleanup improves capacity planning accuracy. Standardize commodity codes, hazmat flags, and handling requirements based on industry standards or your business rules.
Currency and unit conversion creates consistent financial analytics. Convert historical data to standard units while preserving original values for audit trails:
UPDATE shipments
SET freight_cost_usd = freight_cost * exchange_rates.rate
FROM exchange_rates
WHERE shipments.currency = exchange_rates.currency
Batch these updates during low-activity windows and test extensively on development datasets before production deployment.
Step 6: Prevention Protocol Setup (Hours 44-48)
Your 48-hour sprint ends with sustainable monitoring and governance frameworks that prevent regression.
Build a data quality dashboard showing real-time metrics:
- Validation failure rates by data source
- Record completeness percentages for critical fields
- Standardization coverage across core dimensions
- Duplicate detection rates and resolution times
Establish weekly data quality reviews with operations and IT teams. Track trends, investigate anomalies, and adjust validation rules based on business changes.
Create user training protocols that emphasize data quality importance. Show teams how their data entry decisions impact analytics accuracy and business outcomes. When dispatchers understand that accurate timestamps improve customer ETAs, they become quality advocates.
Document escalation procedures for data quality incidents. When validation rules catch systematic issues, who investigates? How quickly must source system problems get fixed? Clear procedures prevent small issues from becoming analytics disasters.
Set up automated reporting that summarizes data quality metrics for stakeholders. Monthly executive reports should show quality trends, business impact of improvements, and investment priorities for the next quarter.
Long-term Data Quality Strategy
Your 48-hour diagnostic fixes immediate problems, but sustainable TMS data quality requires ongoing commitment. In 2025, data quality and governance are business differentiators, not back-office tasks. With AI-driven analytics and self-service platforms expanding, unreliable data can distort forecasts, mislead models, and trigger compliance risks.
Monthly audits should examine data quality trends and catch new contamination sources. As you add carrier integrations, customer portals, or system upgrades, new data quality risks emerge. Regular assessment identifies problems before they impact analytics.
Quarterly reviews focus on validation rule effectiveness and business rule updates. Your product catalog changes, carrier services evolve, and regulatory requirements shift. Data quality rules must adapt to remain effective.
Annual assessments evaluate your entire data architecture. Are source systems becoming more reliable? Do you need additional validation layers? Should you invest in master data management platforms? Strategic planning prevents data quality from becoming a constant firefight.
Modern TMS platforms increasingly offer built-in data quality frameworks. Oracle TM provides data validation templates, SAP includes master data governance tools, and specialized platforms like Transporeon and nShift focus heavily on data consistency. Cargoson emphasizes clean data ingestion from implementation day one, preventing many quality issues entirely.
Remember that data quality improvements deliver compound benefits. Better addresses improve routing accuracy AND customer satisfaction. Consistent carrier codes enable better negotiations AND more reliable capacity planning. Clean product classifications support accurate pricing AND regulatory compliance.
Your TMS analytics can only be as good as the data feeding them. Start with this 48-hour diagnostic, but make data quality a permanent operational discipline. The investment pays dividends in more reliable predictions, better decisions, and analytics you can actually trust.