TMS Data Validation Monitoring: The Continuous Framework That Prevents 85% of Operational Failures After Go-Live

Your TMS automation looks flawless on screen. Orders flow perfectly through load building, tenders go out on schedule, and tracking updates arrive like clockwork. Then Thursday afternoon hits and everything breaks. The address validation service times out. Rate calculations return nonsense numbers. Carrier APIs throw authentication errors. Your operations team scrambles with manual workarounds while customers call asking where their shipments are.
Poor data input guarantees poor visibility output. You'll find most "system failures" trace back to missing load details, inconsistent data formats, or outdated carrier information. More than 70% of organizations encounter roadblocks during TMS deployment, and the majority of those failures stem from data quality issues that surface weeks or months after go-live.
The brutal truth? A logistics company might experience persistent operational inefficiencies after a failed TMS implementation. The system's inability to accurately track shipments could force employees to resort to manual tracking methods, increasing labor costs and reducing operational efficiency. Yet most teams focus on configuring workflows while ignoring the data foundation that makes automation possible.
The Hidden Data Quality Crisis Destroying TMS Performance
Automation amplifies data problems exponentially. A single incorrect SKU dimension in your master data doesn't just affect one shipment. It breaks load planning algorithms, creates phantom capacity, and generates "optimized" routes that fail on the dock floor. Organizations can lose up to 20% of their revenue due to inaccurate data, yet most TMS teams discover these issues only when operations grind to a halt.
Take a packaging manufacturer I worked with last year. Their item master showed 48 cases fit on a pallet, but packaging changed and only 42 cases fit now. The TMS confidently built loads that looked perfect in the system but required emergency re-work at pickup. Load building then packs a trailer that looks feasible on screen but fails on the floor, which triggers a last-minute split shipment, extra appointments, and detention risk. Teams blamed the planner or the warehouse, yet the failure started with a master data record that lacked ownership and change control.
Data quality failures hide inside normal operations because automation repeats mistakes perfectly. Track API response times, data synchronization success rates, and error frequencies alongside operational measures like carrier onboarding speed and compliance reporting accuracy. Your TMS might show 98% successful transactions while 15% of those contain data errors that create downstream problems you never connect back to the source.
Master Data Failures That Break Load Planning
Master data shapes every automated decision your TMS makes. Locations, lanes, carrier profiles, equipment definitions, item dimensions, customer constraints, and accessorial rules form the foundation that algorithms use to build loads, select carriers, and calculate costs. When these records drift from operational reality, automation produces confident recommendations that don't match what your network can actually execute.
Carrier capacity profiles illustrate this perfectly. Your TMS shows Carrier A has 53-foot trailers with 26 pallet positions, but their actual equipment mix includes older 48-foot trailers with 24 positions. Load planning fills orders based on the incorrect capacity, creating loads that require splits or equipment swaps at pickup. The carrier charges extra for the change, your customer delivery window shifts, and dock productivity drops because planned appointments no longer match actual requirements.
Lane data presents another common failure point. Rate shopping algorithms rely on historical performance data to predict transit times and select optimal carriers. If your lane records show 2-day transit from Chicago to Atlanta but recent performance averages 3 days due to capacity constraints, automated carrier selection chooses options that cannot meet customer commitments. You'll find most "system failures" trace back to missing load details, inconsistent data formats, or outdated carrier information.
The 4-Layer Data Validation Framework
Successful shipper TMS data quality requires monitoring across four distinct layers: transaction validation, master data integrity, integration health, and performance metrics. Each layer serves different purposes and requires specific monitoring approaches. Companies must ensure that their data is clean, accurate, and compatible with the new system before go-live. This involves conducting thorough data audits, defining data migration protocols, and running multiple tests to validate data accuracy.
This framework works across major TMS platforms including Oracle TM, SAP TM, MercuryGate (now Infios), Descartes, Blue Yonder, and Cargoson. The specific implementation varies by platform, but the monitoring principles remain consistent regardless of your technology stack.
Layer 1: Real-Time Transaction Validation
Transaction validation catches data errors during order entry and load tendering before they cascade into operational failures. Your validation rules should cover address standardization, weight and cube calculations, appointment availability, and carrier capability matching.
Address validation represents the most critical real-time check. Configure your TMS to validate addresses against USPS databases for domestic shipments and similar services internationally. Reject orders with undeliverable addresses immediately rather than discovering the problem at pickup. Weight and cube validation should compare order totals against item master data and flag discrepancies exceeding defined thresholds.
Appointment validation prevents double-booking and ensures carrier appointments match facility operating hours. Your TMS assigns internal shipment IDs that must map to carrier tracking numbers correctly. Mismatched references create duplicates or orphaned tracking records that never update. Build validation rules that check appointment windows against carrier availability and facility constraints before confirming pickup times.
Carrier capability matching validates that assigned carriers can handle specific requirements like temperature control, hazmat certification, or equipment types. This prevents tendering loads to carriers who cannot execute them, reducing rejections and delays in the procurement process.
Layer 2: Master Data Integrity Monitoring
Master data monitoring focuses on the reference information that shapes automated decisions. This includes carrier profiles, customer constraints, item dimensions, lane performance, and rate structures. Unlike transaction validation, master data monitoring runs in scheduled batches to identify drift and inconsistencies over time.
Carrier profile monitoring compares actual performance against profile data. Track equipment types, capacity utilization, transit times, and service areas to identify profiles that need updates. Set alerts when carrier performance deviates significantly from historical averages or when new equipment types appear in tracking data but don't exist in carrier profiles.
Item master monitoring validates dimensions, weights, and packaging configurations against recent shipment data. 30% of data-related issues stem from poor data migration practices. Compare actual shipped quantities against item records to identify packaging changes or dimension errors that affect load planning accuracy.
Lane data monitoring tracks performance trends and validates route assumptions. Monitor transit times, cost fluctuations, and capacity availability across your key lanes. Flag lanes where actual performance consistently varies from system expectations by more than defined thresholds.
Early Warning System Configuration
Effective monitoring requires alerts that surface problems before they impact operations. Operations teams receive real-time alerts on exceptions requiring intervention. Configure your monitoring to distinguish between normal variance and systemic issues that require immediate attention.
The challenge lies in setting thresholds that catch real problems without generating alert fatigue. Start with conservative thresholds based on historical performance, then tune them as you gather data about normal operational variance. Implement error thresholds that automatically trigger alerts for data anomalies. Research indicates that 90% of successful organizations employ proactive data monitoring systems to address inconsistencies before they escalate.
Alert systems work across platforms including FreightPOP, Blue Yonder, Cargoson, and E2open, though configuration approaches vary. Some platforms offer built-in monitoring dashboards while others require custom reporting or third-party tools.
Critical Data Quality Thresholds
Establish specific thresholds for different data types based on their operational impact. Address match rates should exceed 95% for domestic shipments, with immediate escalation when they drop below 90%. Carrier profile accuracy should maintain 98% consistency between system data and actual performance metrics.
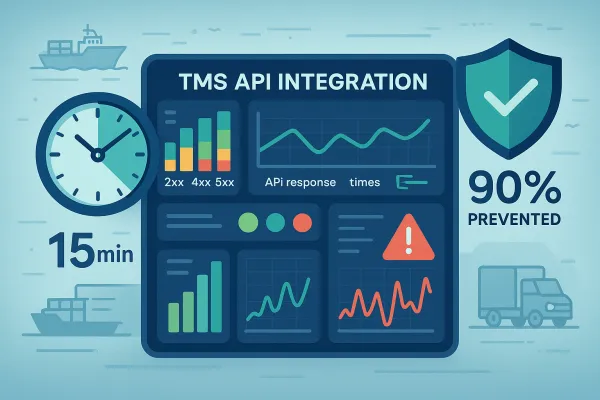
Integration success rates require monitoring across multiple dimensions. API response times should stay under 3 seconds for real-time transactions, with alerts when average response times exceed 5 seconds over a 15-minute window. Data synchronization success rates should exceed 99% for critical integrations like order import and tracking updates.
Master data drift thresholds vary by data type. Item dimension variances exceeding 10% trigger immediate review, while carrier performance deviations of 20% from historical averages warrant investigation. Lane performance alerts activate when transit times exceed expected ranges by more than one business day consistently over a week.
Exception Escalation Workflows
Configure automated workflows that respond to threshold breaches with appropriate escalation levels. Minor issues like individual address validation failures might generate logging entries and daily summary reports. Major issues like API authentication failures or widespread data synchronization problems require immediate notifications to technical teams.
Create temporary blocking mechanisms for severe data quality issues. When carrier profile accuracy drops below acceptable thresholds, temporarily exclude that carrier from automated load tendering until profiles are verified and updated. This prevents systematic errors from propagating through multiple shipments.
Manual override processes should exist for urgent situations where data validation rules might block legitimate transactions. Document these overrides carefully and review them regularly to identify patterns that suggest rule adjustments or master data updates are needed.
The 15-Minute Daily Health Check Protocol
Daily monitoring focuses on leading indicators that predict problems before they cascade into operational failures. Integrated reporting and dashboards in a TMS are vital for effective performance monitoring. Customized dashboards offer an immediate view of Key Performance Indicators (KPIs) through interactive reports, facilitating a quick grasp of business performance.
Your 15-minute health check should cover transaction processing rates, integration status, master data consistency, and exception trending. This routine works across platforms including Manhattan Active, E2open, and Cargoson, though the specific metrics and dashboard configurations vary by system.
Start with transaction volume and error rates. Compare current processing volumes against historical averages for the same day of week and time of year. Look for unusual spikes or drops that might indicate system issues or unexpected business changes. Review error rates across different transaction types to identify patterns suggesting specific problems.
Check integration health across all critical data flows. Monitor API response times, authentication status, and data transfer volumes for connections to ERP systems, carrier portals, and third-party services. If your TMS checks carrier status every hour, push for 15-minute intervals during business hours. Identify any integrations showing performance degradation before they fail completely.
Dashboard Metrics That Matter
Focus your dashboard on metrics that predict operational problems rather than reporting what already happened. Data validation failure rates show emerging quality issues before they affect customer shipments. Integration error trends reveal system stability problems that might cause processing delays.
Track master data update frequencies to ensure reference information stays current. Monitor the lag time between master data changes and their propagation to all dependent systems. Excessive delays suggest integration issues or process bottlenecks that need attention.
Exception handling metrics reveal process effectiveness. Track the time from exception detection to resolution, the percentage of exceptions resolved automatically versus manually, and the recurrence rate of similar exceptions. These metrics help identify process improvements and training needs.
Performance trending should focus on leading indicators like capacity utilization predictions, carrier performance variance, and cost estimation accuracy. These metrics help teams proactively adjust operations before problems impact customer service.
Recovery Protocols When Validation Fails
Data quality isn't a one-time cleanup project. Systems such as TMS enable companies to move from intuitive management to data-driven decision-making. In the long term, this approach translates directly into real financial savings and a more predictable production process. It requires ongoing production control similar to dock scheduling or inventory accuracy management.
When validation failures occur, immediate containment prevents the problem from spreading to additional transactions. Identify the scope of affected data, implement temporary workarounds to maintain operations, and begin root cause analysis to prevent recurrence.
Recovery approaches work across platforms including Transporeon, nShift, and Cargoson, though specific tools and procedures vary by system architecture. The key is having documented procedures that teams can execute quickly under pressure.
Containment starts with stopping the flow of bad data. If address validation is failing, switch to manual address verification for urgent shipments while technical teams investigate the service disruption. If rate calculations are returning incorrect values, use historical rate tables as a backup until the pricing engine is repaired.
Impact assessment determines which shipments and customers are affected by the data quality failure. Prioritize corrections based on customer criticality, shipment urgency, and potential cost exposure. Communicate proactively with affected customers about potential delays or changes to their shipments.
Post-Incident Analysis Template
Structured post-incident analysis prevents recurring failures and improves overall system resilience. Document the timeline of events, identify root causes, assess business impact, and define corrective actions with specific owners and completion dates.
Timeline reconstruction should identify when the problem started, when it was first detected, and when it was resolved. Look for gaps between problem onset and detection that suggest monitoring improvements are needed. Review response times to identify process bottlenecks that delayed resolution.
Root cause analysis should distinguish between immediate triggers and underlying systemic issues. A failed API integration might be the immediate cause, but inadequate monitoring or missing backup procedures might be the underlying problems that allowed the failure to persist.
Impact assessment quantifies the business cost of the failure including delayed shipments, expedited transportation costs, customer service overhead, and potential revenue loss. This data helps justify investments in monitoring improvements and preventive measures.
Corrective actions should address both immediate fixes and long-term prevention. Immediate actions might include updating monitoring rules or implementing additional validation checks. Long-term actions might involve system architecture changes, process improvements, or additional staff training.
Start your TMS data validation monitoring implementation by choosing one layer from the framework and establishing baseline measurements. Focus on transaction validation first if your team handles high order volumes, or master data monitoring if you're experiencing frequent operational exceptions. Leverage analytics and reporting tools to monitor performance in real time. Establish a cadence for regular reviews to identify improvement opportunities. Remember that effective monitoring evolves with your operations, so plan to adjust thresholds and add new validation rules as your understanding of data quality patterns improves.