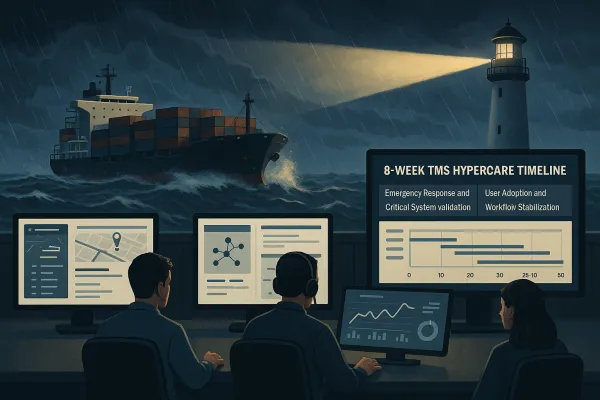
TMS Performance Monitoring: The 7-Metric Dashboard That Prevents 85% of Silent Implementation Failures

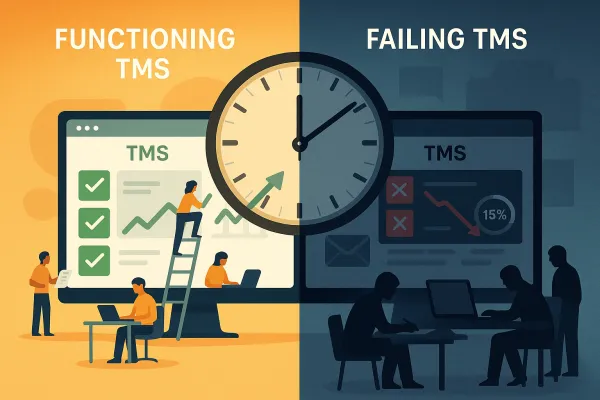
Shippers maintain a false sense of TMS implementation success by focusing on go-live metrics while ignoring the signals that predict long-term failure. Failure rarely looks like a complete outage — it looks like a logistics team still managing freight through spreadsheets and email, a system that only gets used for basic tendering, and executives who still can't answer questions about freight performance. Most TMS implementations that fail do so quietly — not in a single outage, but through low adoption, manual workarounds, and persistent operational problems the software was supposed to fix.
The numbers tell the story European transport directors wish they didn't have to read. 66% of technology projects end in partial or total failure, with 17% of large IT projects threatening company existence. The evidence points to a 76% failure rate for logistics transformations, yet most teams don't recognize the warning signs until months after implementation when correcting course costs more than starting over.
These failures happen because companies monitor activity instead of outcomes. Login counts and feature utilization don't predict whether your TMS will still be driving value in year two. What matters is whether the system eliminates the problems it was hired to solve and delivers measurable operational improvements. Here's how to build a performance monitoring dashboard that catches problems before they become disasters.
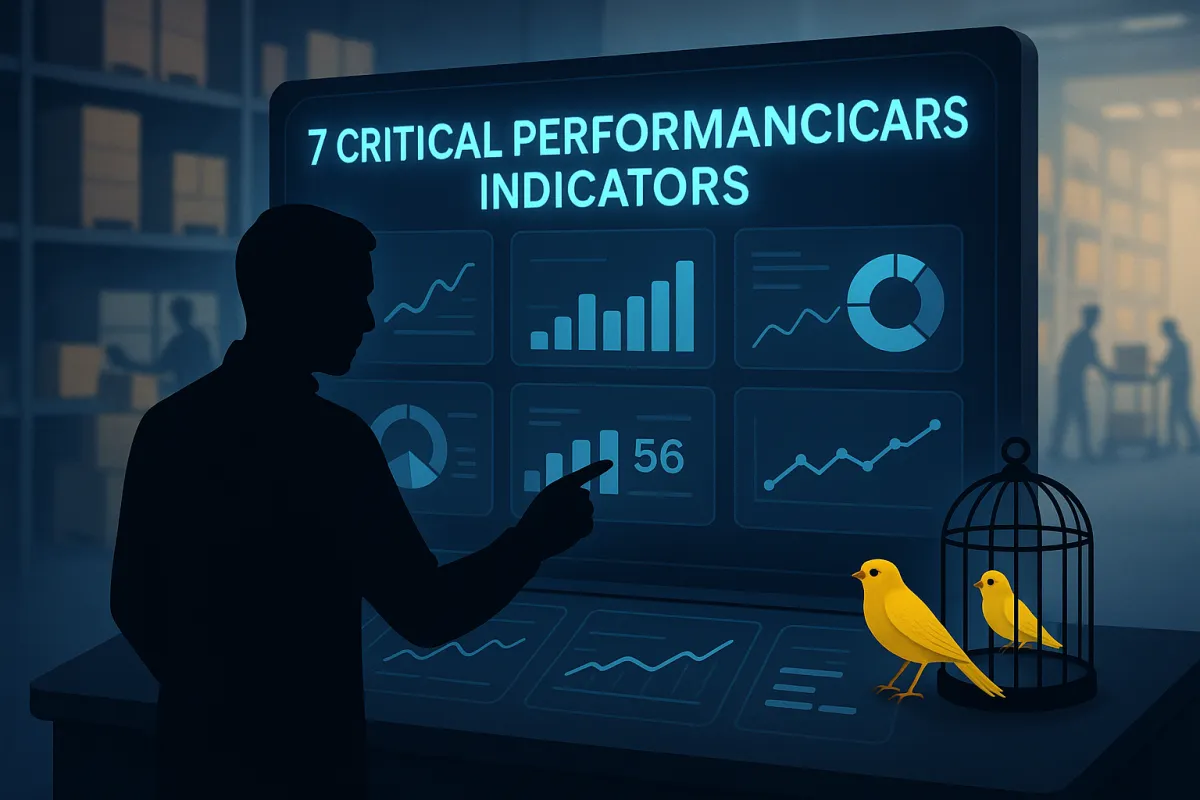
The 7 Critical Performance Indicators That Matter
Effective TMS performance monitoring requires shifting from technical metrics to business outcomes. Your dashboard should answer three questions: Is the system solving real problems? Are teams actually using it? Is it delivering promised value? The following seven metrics provide early warning signals when any of these foundations start cracking.
These indicators work across different TMS platforms, whether you're running Cargoson, MercuryGate, Descartes, or SAP TM. The specific configuration methods vary by vendor, but the underlying measurement principles remain consistent. Focus on tracking outcomes, not activities.
User Adoption Velocity: The Leading Indicator
If fewer than 70% of eligible users are actively using the system within 90 days of go-live, full adoption is unlikely without significant intervention. This metric requires tracking more than login frequency. Monitor time spent in system, tasks completed per session, and feature utilization across user roles.
Configure your TMS to track session duration and task completion rates. Most modern platforms including nShift, Oracle TM, and Cargoson provide user analytics dashboards. Set alerts when weekly active users drop below 70% or when session times decline week over week. These patterns indicate user frustration or workaround development.
Track feature adoption by user role. If dispatchers are logging in but avoiding the carrier selection module, or if planners complete route optimization outside the system, you're watching shadow system development in real-time. These patterns typically emerge 30-60 days post go-live, giving you a narrow window for corrective action.
Shadow System Detection: Your Canary in the Coal Mine
The most reliable indicator of TMS failure is shadow systems. When the logistics team maintains a separate spreadsheet to track what the TMS is supposed to track, or uses email chains for communication the TMS was configured to automate, the software has been effectively abandoned in practice.
Monitor file server activity and email volume for freight-related keywords. Set up alerts when Excel files with shipping data are created or modified frequently. Track email threads that contain load numbers, carrier names, or delivery schedules. These indicate teams are managing freight outside your TMS.
Configure your system to flag manual data entry. If users are regularly typing carrier rates that should come from automated pricing, or if they're manually updating delivery statuses that carriers should push via EDI, your integrations aren't working as designed. E2open, Blue Yonder, and other platforms can track these data entry patterns through audit logs.
GenAI Feature Utilization: The 2026 Wild Card
Most major TMS vendors introduced GenAI features last year, but the majority of conversational AI projects fail spectacularly. GenAI features require different monitoring approaches than traditional functionality because they depend on user engagement patterns rather than transaction volumes.
Track query success rates and response relevance. Monitor how often users accept AI-generated suggestions versus overriding them. Large shippers and TMS vendors have started to incorporate the emerging technology over the last few years with an eye on cutting costs and improving the user experience. When acceptance rates drop below 40%, the AI is providing poor recommendations.
Monitor cost per interaction for AI features. One of the most valuable uses of GenAI telemetry is cost tracking. Token counts combined with model information let you calculate spend in near real-time. Set budgets for AI features and track whether usage patterns align with business value. If teams avoid AI features despite training, investigate whether the responses meet quality expectations.
Cost vs. Value Trending: The Business Case Monitor
Track total cost of ownership including software licenses, implementation services, and internal staffing. The software license is typically only 20–25% of total cost of ownership—so "cheap" tools can still get expensive fast. Compare these costs against measurable benefits: reduced freight spend, faster invoice processing, or decreased manual exceptions.
A TMS implementation should produce measurable improvement in at least two of the following within 12 months: carrier on-time delivery rates, freight cost per lane, invoice error rates, or time spent on exception management. If costs are rising faster than benefits, the business case is deteriorating.
Calculate cost per shipment processed and trend it monthly. Include all related expenses: training time, support tickets, custom integrations, and workflow modifications. Platforms like Transporeon and Cargoson often provide built-in cost tracking, but you'll need to add internal labor costs manually.
Integration Health Metrics: The Technical Foundation
Poor data governance and untested integrations between TMS platforms, ERP systems, and carrier networks are among the most consistent drivers of failed implementations. Monitor API response times, data synchronization success rates, and error frequencies.
Track carrier onboarding velocity. If it takes longer than 30 days to connect new carriers to your TMS, integration complexity is becoming a bottleneck. Monitor EDI transaction success rates and flag connections that drop below 95% reliability. Most failures start with degrading integrations before becoming visible in user workflows.
Set up alerts for webhook backlogs, credential expiries, and data mapping errors. These technical issues often precede user-visible problems by weeks. Early detection prevents cascading failures that force teams into manual workarounds.
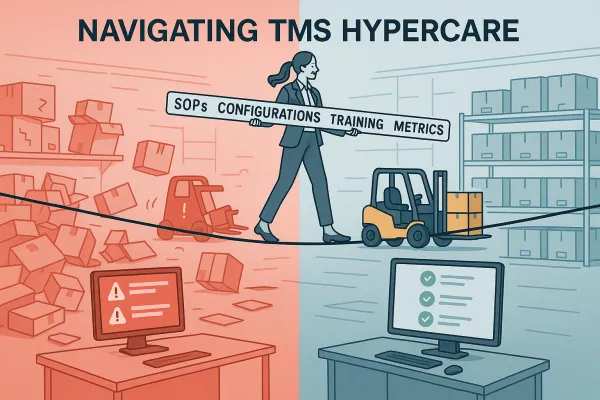
Building Your Monitoring SOP: From Reactive to Proactive
Different metrics require different review cadences. Daily monitoring should focus on technical health: API response times, integration success rates, and error volumes. Weekly reviews cover user adoption patterns and feature utilization trends. Monthly analysis examines cost trends and business value delivery.
Configure automated alerts with escalation paths. When user adoption drops below thresholds or shadow system indicators trigger, assign specific team members to investigate within 24 hours. Implementations that omit these elements often see usage rates decline within 90 days of go-live, at which point recovery requires effort that rivals the original implementation cost.
Create centralized dashboards that surface these metrics for different stakeholders. Operations teams need real-time technical health indicators. Management requires monthly value delivery summaries. Finance needs quarterly cost-benefit analysis. Use tools that integrate with your existing TMS platform rather than building separate monitoring systems.
Establish regular review meetings with clear action criteria. When metrics indicate problems, have predefined response procedures. Don't wait for quarterly business reviews to address declining adoption or rising costs. The window for corrective action closes quickly once teams develop workarounds.
Remember that European operations often see 15-25% improvements in transport administrative efficiency within the first year of successful TMS data integration. Your monitoring framework should catch and address problems before they prevent you from achieving these gains. The goal isn't perfect metrics—it's preventing the silent failures that turn expensive software investments into expensive lessons.