TMS Silent Configuration Failures: The 48-Hour Diagnostic Framework That Detects Shadow Systems Before They Replace Your Platform

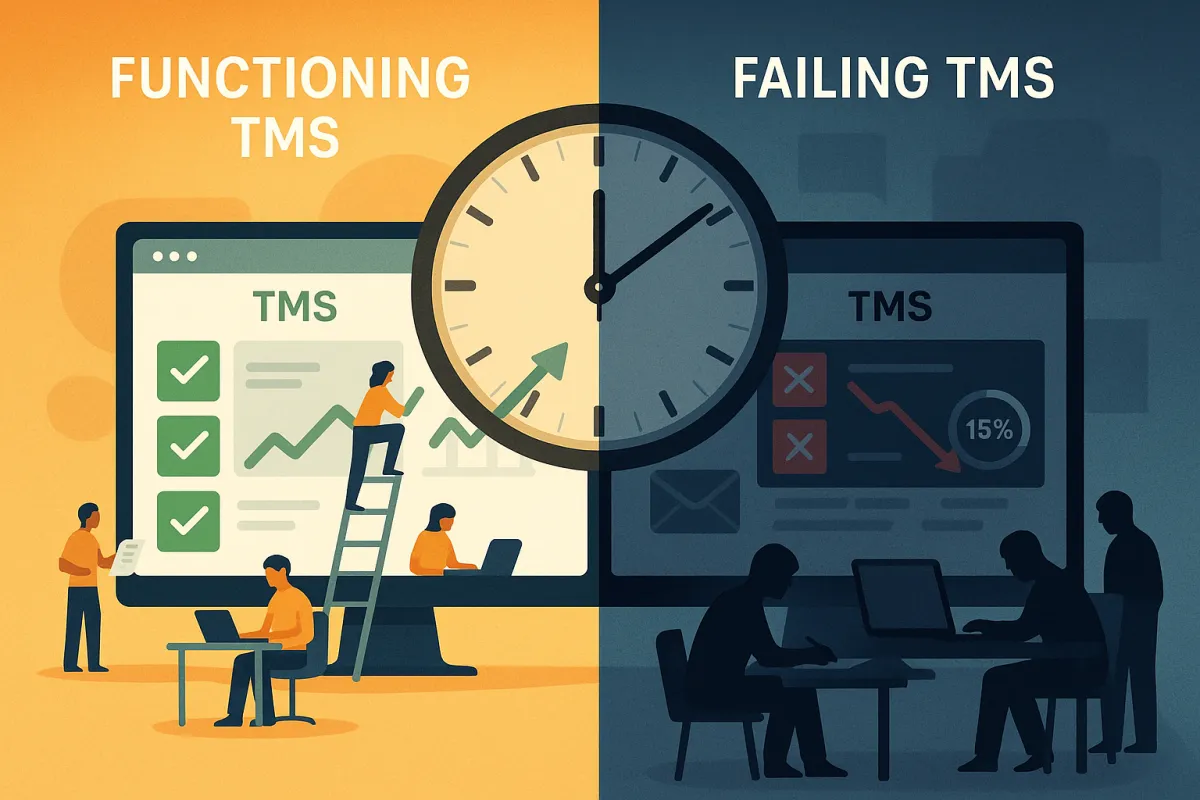
Failure rarely looks like a complete outage — it looks like a logistics team still managing freight through spreadsheets and email, a system that only gets used for basic tendering, and executives who still can't answer questions about freight performance. Your TMS configuration might be technically working, but if operations teams are building shadow systems to compensate for functionality gaps, you have a silent configuration failure brewing.
These failures don't announce themselves through dramatic system alerts. Instead, they accumulate quietly through manual workarounds, declining adoption rates, and persistent operational problems the software was supposed to eliminate. Budget overruns hit 75% of European TMS implementations, and 66% of technology projects end in partial or total failure. The gap between "system working" and "system delivering value" is where most TMS implementations stall.
The Silent Failure Pattern: When TMS Works But Operations Don't
The most reliable indicator of TMS failure is shadow systems. When the logistics team maintains a separate spreadsheet to track what the TMS is supposed to track, or uses email chains for communication the TMS was configured to automate, the software has been effectively abandoned in practice.
Silent failures manifest in five ways that operations teams often dismiss as temporary adjustments. Not all TMS failure announces itself at once. More often, it accumulates through a series of signals that individual teams notice but no one escalates. Recognizing these warning signs early is what separates recoverable implementations from ones that require a full restart.
Leading TMS vendors like Blue Yonder Transportation Execution, Descartes TMS, Trimble TMW.Suite, and Cargoson all see this pattern: implementations that meet technical acceptance criteria but fail operational adoption tests. The software functions correctly, yet logistics teams revert to pre-implementation workflows when pressure builds.
The Five Silent Failure Indicators Operations Teams Miss
When exception queues grow after go-live, it typically reflects gaps in carrier rate setup, EDI mapping errors, or freight audit logic that was not fully tested. Here are the specific indicators that predict implementation failure before budget overruns become obvious:
- Manual workarounds become the real system: When experienced dispatchers consistently route critical freight outside the TMS, it signals that confidence in the system's dispatching logic has not been established. Each manual override reinforces the perception that the system cannot be trusted and accelerates the drift back to pre-implementation habits.
- Low adoption rates within 90 days: Organizations that omit a formal change management program routinely see adoption rates collapse within the first 90 days of go-live, erasing the anticipated operational gains. If fewer than 70% of eligible users are actively using the system within 90 days of go-live, full adoption is unlikely without significant intervention.
- Unchanged invoice error rates: A TMS implementation should produce measurable improvement in at least two of the following within 12 months: carrier on-time delivery rates, freight cost per lane, invoice error rates, or time spent on exception management. If none of these have moved, the system is not performing its primary function.
- Exception handling stays in email: Exception volume climbing instead of declining signals fundamental configuration gaps that create more work instead of reducing it.
- Adoption metrics absent from executive reporting: Implementations that do not measure system usage by role and by function cannot distinguish teams that are adopting from teams that are not. Without that visibility, leadership often assumes adoption is progressing until operational problems surface in financial results.
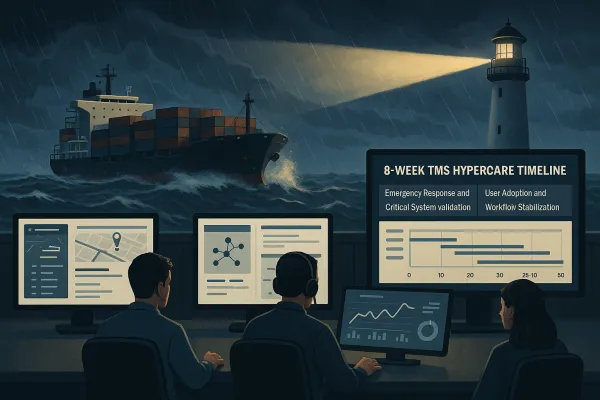
The 48-Hour Configuration Diagnostic Protocol
TMS implementation failure rarely looks like a dramatic collapse. More often, it looks like a system that went live six months late, cost twice the original budget, and is now used by only a fraction of the team it was designed for. TMS implementation failure is best understood as a deployment that does not deliver its intended operational value, even if the software technically functions.
This diagnostic framework identifies configuration gaps before they become operational disasters. The approach focuses on data flow integrity and user behavior patterns - the two areas where silent failures accumulate fastest.
European specialists like Alpega, Transporeon, nShift, and Cargoson have built pre-configured integrations to reduce implementation complexity, but configuration gaps still emerge when business logic doesn't match operational reality.
Day 1: Data Flow and Exception Queue Analysis
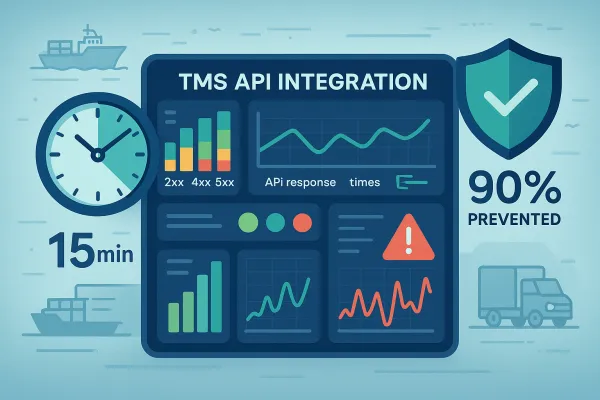
Integration error logs growing unreviewed. Data synchronization failures between the TMS and connected systems accumulate quietly when monitoring processes aren't established from day one.
Start with these specific checks:
- Exception queue volume trends: Measure exception creation rate versus resolution rate across the first 30 days post-go-live. Growing backlogs indicate configuration logic gaps.
- Integration error logs: Review all EDI mapping errors, API timeout failures, and data synchronization warnings. Document patterns by carrier, lane, or data type.
- Manual override frequency: Count how often dispatchers bypass system recommendations for "critical" shipments. This metric predicts long-term adoption failure.
The diagnostic reveals whether your TMS configuration matches operational reality or creates additional work that teams will eventually route around.
Day 2: User Adoption and Workflow Reality Check
TMS vendors typically measure success by login frequency and feature utilization. If your logistics team logs in only to complete a specific task and exits immediately, or if certain modules have never been used after go-live, you are not realizing the intended value.
Focus your analysis on behavior patterns that indicate system abandonment in progress:
- Session duration by user role: Track how long planners, dispatchers, and customer service representatives stay logged in. Brief sessions suggest task-specific usage rather than workflow integration.
- Module utilization rates: Identify which TMS modules remain unused 30-60 days after training. Unused modules often indicate gaps between configured functionality and operational needs.
- Parallel system usage: Document continued reliance on spreadsheets, email chains, or manual processes that the TMS was designed to replace.
The Recovery Playbook: From Diagnosis to Stabilization
The options are re-implementation (restart with better scoping and change management), module-level repair (fix the specific modules that aren't working), or a model change to managed transportation. The right choice depends on how much of the failure is technical versus organizational.
Rescue projects typically cost 40-60% of original implementation budget and take 6-9 additional months. The key decision point is whether the business case for rescue is stronger than switching operational models entirely.
Successful recoveries often involve vendors like MercuryGate, Descartes, Manhattan Active, or cloud-native solutions like Cargoson that can address specific configuration gaps without full platform replacement.
30-Day Stabilization Metrics and Checkpoints
Effective organizational change management should address: role-specific training for planners and dispatchers, executive dashboards that surface adoption metrics, and a defined escalation path for exceptions the system cannot handle.
Stabilization requires structured daily stand-ups for the first 14 days, dedicated stabilization lead assignment, and weekly vendor support engagement. Track these specific checkpoints:
- Day 14: Daily issue triage results - Exception queue reduction rate, user confidence indicators, and manual override frequency trends
- Day 30: Retrospective on what's working versus broken - Module-level functionality assessment and workflow integration success rates
- Day 60: KPI review of operational metrics - Measurable improvement in at least two areas: carrier performance, freight costs, invoice accuracy, or exception management efficiency
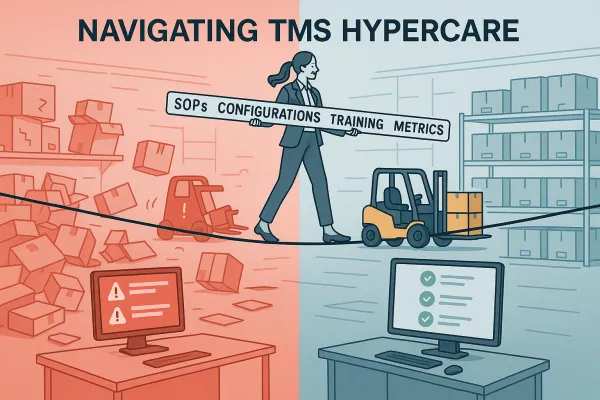
Prevention: Configuration Practices That Stop Silent Failures
Single biggest controllable safeguard: a 2–4 week parallel-run period where the old and new TMS run side-by-side and dispatch double-keys until reconciled. This practice surfaces configuration gaps before they become operational crises.
Effective parallel run discipline means dispatchers process every load in both systems and teams reconcile any disagreements daily. This approach reveals configuration logic gaps that standard testing misses.
Configuration best practices include:
- Role-specific training programs that address actual workflows, not just system features
- Executive dashboards that surface adoption metrics and make system usage visible to leadership
- Defined escalation paths for exceptions the system cannot handle automatically
The Executive Dashboard That Actually Prevents Failures
A transport management system dashboard should do one job exceptionally well: tell you what is happening in your freight operation right now, what is about to break next, and what to do about it. If your "dashboard" is a stack of reports, you do not have visibility. You have homework.
Configurable dashboards let teams build their own views without IT tickets or waiting weeks for a report that's already stale. Track demand allocation, capacity utilization, carrier performance, and delivery metrics, sliced by mode, lane, carrier, or customer. The data bends to how your business thinks, not a vendor's default template.
The most effective dashboards integrate control tower capabilities that bring together GPS tracking, IoT sensors, predictive ETAs, container aggregation, warehouse monitoring, and analytics in one dashboard. Carrier performance, inventory levels, and delivery data sit side by side, making it possible to spot patterns that siloed systems hide.
Key dashboard metrics that prevent silent failures:
- User adoption rates by role and module - Track who's using what functionality and identify abandonment patterns early
- Exception queue trends and resolution times - Monitor whether configuration is reducing or creating operational work
- Manual override frequency - Measure system confidence levels and workflow integration success
- Data synchronization success rates - Track integration health between TMS and connected systems
A strong dashboard wins with fewer, higher-signal metrics, clear thresholds, and a short path from insight to action. More charts often slow teams down. Focus on metrics that trigger specific operational decisions rather than general awareness.
Silent TMS configuration failures cost more than dramatic outages because they persist undetected for months. European shippers who act decisively within the next 90 days position themselves to navigate 2026's perfect storm successfully, while those who delay risk joining the statistics of failed implementations and budget overruns plaguing reactive procurement strategies.
The 48-hour diagnostic framework identifies these failures while recovery remains cost-effective. Use it before your operations teams build shadow systems that replace your platform entirely.